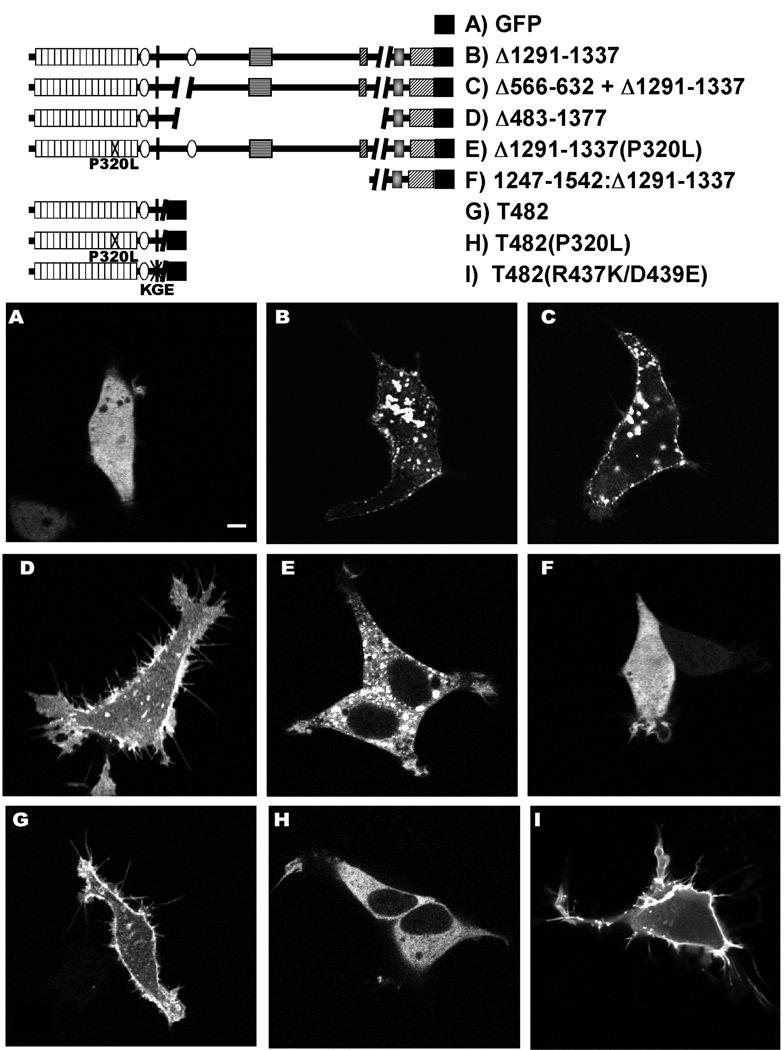
Figure 8. Subcellular distribution of densin variants in transfected HEK293 cells and effects on cell morphology.
The legend (top) shows domain structures of specific densin splice variants with or without the indicated mutations that were expressed in HEK293 cells with a C-terminal GFP. The panels show single optical sections (≈ 1 µm thick) of representative live cells collected using a confocal microscope approximately 24 hours after transfection. The scale bar in Panel A indicates 5 µm and applies to all panels.

