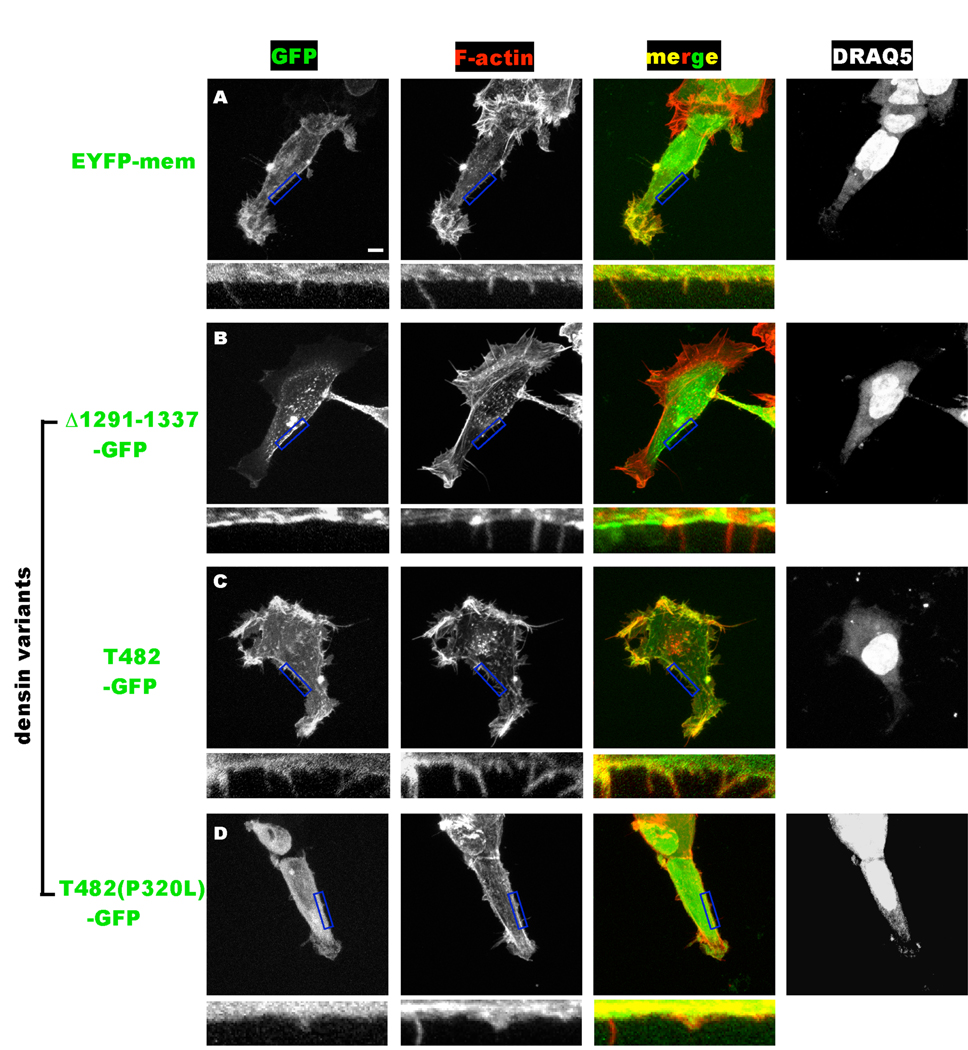
Figure 9. Differential targeting of densin splice variants to F-actin correlates with changes of HEK293 cell morphology.
Cells expressing EYFPmem or the indicated densin-GFP fusion proteins (at left) were fixed ≈24 hours after transfection and stained with rhodamine-phalloidin (F-actin) and DRAQ5 (nuclei). The main panels show Z-stacks of a series of 1 µm optical sections/images of representative cells of each color channel in grayscale. A merged color image of the GFP (green) and F-actin (red) channels is also shown with the color channels intentionally over-saturated to detect fine filopodia-like processes. The scale bar indicates 5 µm, and applies to all of the main panels. Regions of the plasma membrane outlined by the blue box in the main GFP, F-actin and merged panels are magnified below to show filopodia.

