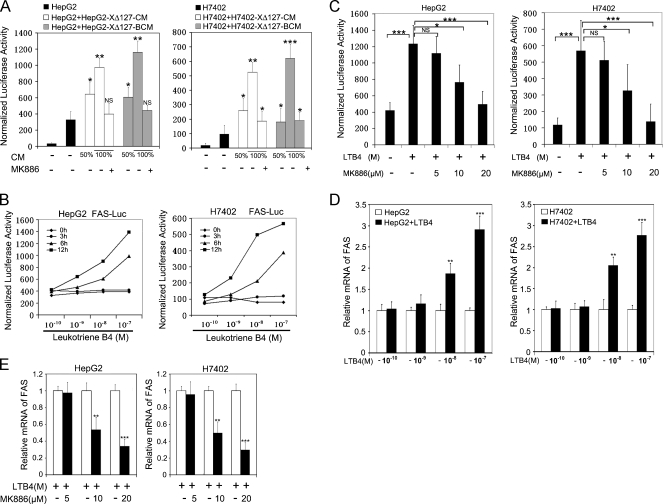
Figure 5.
LTB4 is involved in the up-regulation of FAS. (A) HepG2 (or H7402) cells were transfected with 0.3 µg of plasmid of FAS promoter-luciferase reporter gene, respectively. We treated the transfected cells with conditioned medium (CM) from HepG2-XΔ127 (or H7402-XΔ127) cells or boiled conditioned medium (BCM) from HepG2-XΔ127 (or H7402-XΔ127) cells at indicated the different concentration for 12 hours before the cell lysates were obtained and luciferase activity was measured. In addition, HepG2 (or H7402) cells were also treated with 100% HepG2-XΔ127 CM (or H7402-XΔ127 CM), which were pretreated with 20 µM MK886 for 6 hours. Data are representative of three independent experiments. Values represent mean ± SD (n = 3). *P < .05 versus control, **P < .01 versus control, ***P < .001 versus control (Student's t test). (B) HepG2 (or H7402) cells were transfected with 0.3 µg of plasmid of FAS promoter-luciferase reporter gene, respectively. We treated the transfected cells with the addition of 0.1, 1, 10, or 100 nM LTB4 or without LTB4 at different time points (3, 6, and 12 hours) before cell lysates were obtained and luciferase activity was measured. Data are representative of three independent experiments. P < .01 (Student's t test) (C) HepG2 (or H7402) cells were incubated with the addition of 100 nM LTB4 together with 5, 10, or 20 µM MK886 for 6 hours before cell lysates were obtained and luciferase activity was measured. Data are representative of three independent experiments. Values represent mean ± SD (n = 3). *P < .05 versus control, **P < .01 versus control, ***P < .001 versus control (Student's t test). (D) HepG2 (or H7402) cells were treated with the addition of LTB4 (0.1, 1, 10, or 100 nM) for 12 hours. Then, the FAS mRNA was examined by real-time PCR, respectively. Plotted are the means ± SD of three samples normalized to β-actin. Statistically significant differences relative to FAS mRNA levels in HepG2 (or H7402) cells, arbitrarily set to 1.0, are indicated: *P < .05, **P < .01, ***P < .001 (Student's t test). (E) HepG2 (or H7402) cells were incubated with the addition of 100 nM LTB4 together with 5, 10, or 20 µM MK886 for 6 hours. The mRNA levels of FAS were examined by real-time PCR, respectively. Plotted are the means ± SD of three samples normalized to β-actin. Statistically significant differences relative to FAS mRNA levels in HepG2 (or H7402) cells without MK886, arbitrarily set to 1.0, are indicated: *P < .05, **P < .01, ***P < .001 (Student's t test).

