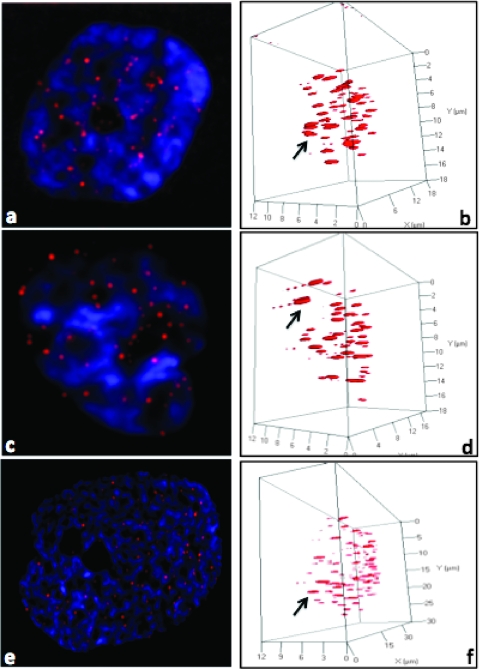
Figure 1.
Two-dimensional (A, C, E) and three-dimensional images (B, D, F) of human GBM nuclei (blue) and their telomeres (red) imaged and visualized with AxioVision 4.6. Nuclear telomere distribution patterns define TAs indicated with an arrowin the three categories of patient: (A, B) from P7 in category 1, (C, D) from P9 in category 2, and (E, F) from P1 in category 3. The arrows point to the telomere aggregates.

