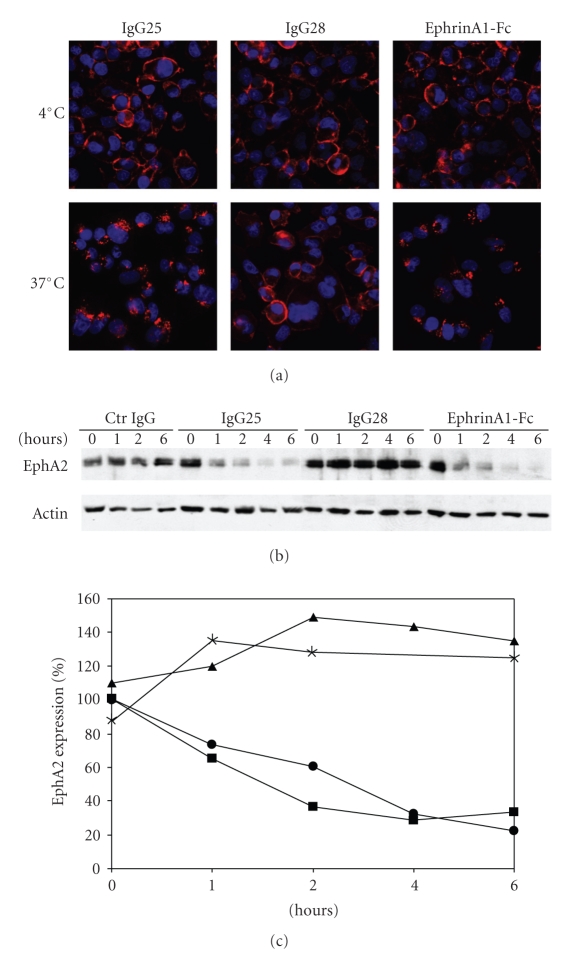
Figure 2.
IgG25- and IgG28-mediated EphA2 internalization and degradation in MiaPaCa2 cells. (a) EphA2 internalization in response to IgG25, IgG28, and ephrinA1-Fc treatment. mAbs and ephrinA1-Fc labeled in red while cell nuclei in blue. Images were acquired at 20× magnification. Localization was revealed 1 hour after incubation on cells either at 4°C or at 37°C. (b) Time course Western blot analysis of EphA2 degradation after treatment with control IgG, IgG25, IgG28, and ephrinA1-Fc; anti-β-actin was used as loading control. (c) Densitometric analysis of the level of EphA2 expression measured by Western Blot in cells treated with control IgG (asterisks), IgG25 (squares), IgG28 (triangles), and ephrinA1-Fc (circles). Data are expressed as percentage of EphA2 expression over time.

