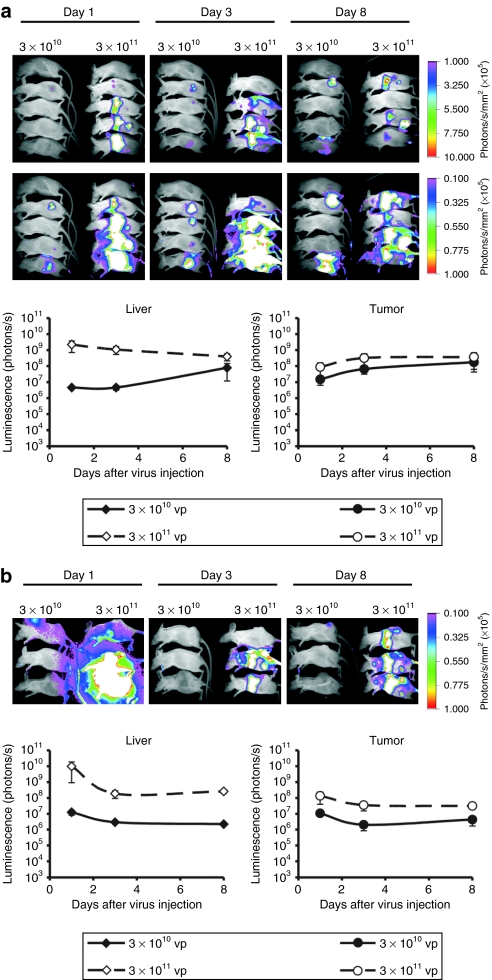
Figure 5.
Infection of hepatocytes and tumor cells after low- and high-dose i.v. injections of Ad-GL-HB. (a) Mice with established s.c. Hep3B tumors (55 days after cell injection; average tumor volume 450 mm3) were predosed i.v. with 3 × 10¹⁰ vp of Ad-DsRed-RD followed 4 hours later by i.v. injection of 3 × 10¹⁰ or 3 × 10¹¹ vp of Ad-GL-HB (n = 5). Luciferase expression was detected by whole-body imaging on days 1, 3, and 8 after virus injection. High (upper row) and low (bottom row) scales are shown (top). Luminescence signals from liver and tumor areas were quantified and plotted (bottom). Data are presented as mean ± SEM. (b) Mice with established s.c. DU145 tumors (34 days after cell injection, average tumor volume 736 mm3) were injected as in a (n = 3) and imaged on days 1, 3, and 8 after virus injection. Luminescence signals from liver and tumor areas were quantified and plotted. Data are presented as mean ± SEM. Ad, adenovirus; i.v., intravenous; s.c., subcutaneous; vp, virus particles.

