Figure 5.
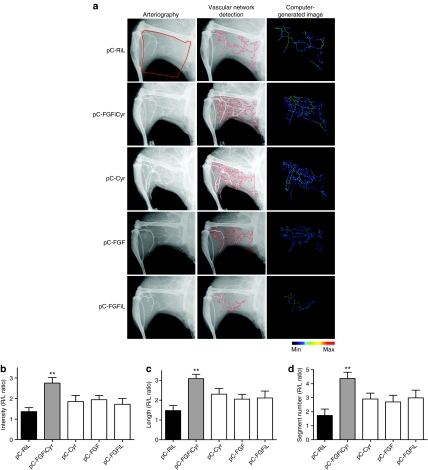
Angiographic analysis of collateral vessel development in the ischemic limb. (a) Representative angiograms of collateral vessel formation in ApoE KO C57Bl/6 mice at day 21 after surgery. The area of interest (red zone) was delineated by the position of the ligature on the femoral artery, the knee, the edge of the femur, and external limit of the leg (left column). The image analysis software (Morpho Expert) detected vessel network automatically (medium column) and created computer-generated images (right column) for quantification. A color scale illustrates vessel size variations from thin (dark blue) to large (red) values. (b–d) Quantitative analysis of three criteria: angiographic score (vessel area) (b), total length (c), and number of segments (d) of collateral vessel network. These criteria were determined by pixel analysis and expressed as the ratio of the ischemic to nonischemic limb (R/L ratio). The data are the mean ± SEM (n = 6 animals per group) (**P < 0.01 versus control group).

