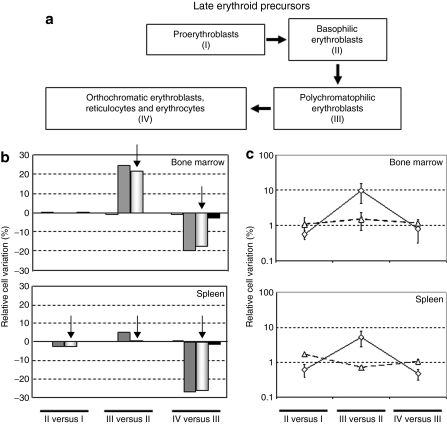
Figure 4.
Dynamics of eythrodifferentiation in the bone marrow and spleen of animals transplanted with transduced cells. (a) Schematic diagram of erythroblast maturation indicating in roman numerals the populations studied in b and c. See also Figure 3 for flow cytometry analysis of these populations (b) Relative cell variation between two consecutive erythroid precursor populations is indicated. Steps I–IV are referred to the populations established in Figure 3. Positive and negative values indicate an increase or decrease in cellularity between two consecutive differentiation steps. White bars, wild-type mice; gray bars, PKD mice; hatched bars, deficient mice transplanted with cells transduced with the control vector; black bars, deficient mice transplanted with cells transduced with the therapeutic vector. (c) Proliferative variation observed between two successive erythroid EGFP+ populations in mice transplanted with cells transduced with the control vector (open triangle) or with the therapeutic vector (open diamond). EGFP, enhanced green fluorescent protein.

