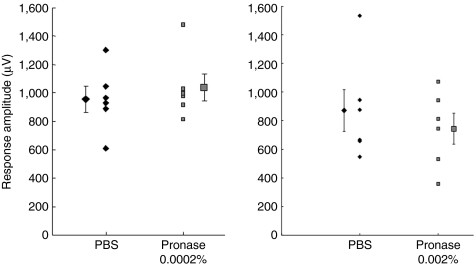
Figure 3.
Peak amplitude of visually evoked potentials in response to full-field stimulation of eyes injected with phosphate-buffered saline (PBS) (diamonds) or Pronase (squares) at the low dose, n = 6, and high dose, n = 6. Recordings were performed on the contralateral visual cortex. Means for each data set are shown laterally displaced. Error bars indicate SEM. The two data sets for each dose were not significantly different (n = 6, P > 0.6, Wilcoxon signed-rank test).

