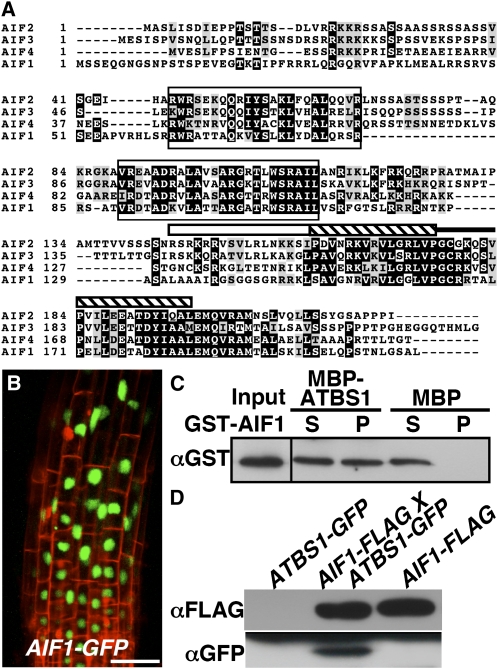
Figure 6.
AIF1 Interacts with ATBS1 Both in Vitro and in Vivo.
(A) Alignment of four members of the AIF family (AIF1, At3g05800, NP_566260; AIF2, At3g06590, NP_974239; AIF3, At3g17100; NP_566567; AIF4, At1g09250, NP_563839). Alignment was performed using the Tcoffee program (http://tcoffee.vital-it.ch/cgi-bin/Tcoffee/tcoffee_cgi/index.cgi). Identical amino acids are shaded black, while similar amino acids are shaded gray using the BoxShade server at http://www.ch.embnet.org/software/BOX_form.html. The white bar indicates the basic region, the hatched bar represents the helix motif, while the black line denotes the loop region.
(B) Confocal analysis of the root tip of a pBRI1:AIF1-GFP transgenic line. GFP fluorescence is shown in green, and cell wall staining by propidium iodide is shown in red. Bar = 50 μm.
(C) A pull-down assay to test the ATBS1–AIF1 interaction. MBP, MBP-ATBS1, and GST-AIF1 were purified from E. coli. Amylose resin was used to pull down the MBP or MBP-ATBS1 and its interacting proteins. An anti-GST antibody was used to detect the copurified AIF1 by immunoblot analysis.
(D) AIF1 interacts with ATBS1 in plants. FLAG-tagged AIF1 was immunoprecipitated from total protein crude extracts isolated from the parental lines, pBRI1:ATBS1-GFP and pBRI1:AIF1-FLAG, and their F1 plants and analyzed by immunoblotting with antibody against FLAG or GFP.

