Figure 7.
AIF1 Is a Negative Regulator of BR Signaling.
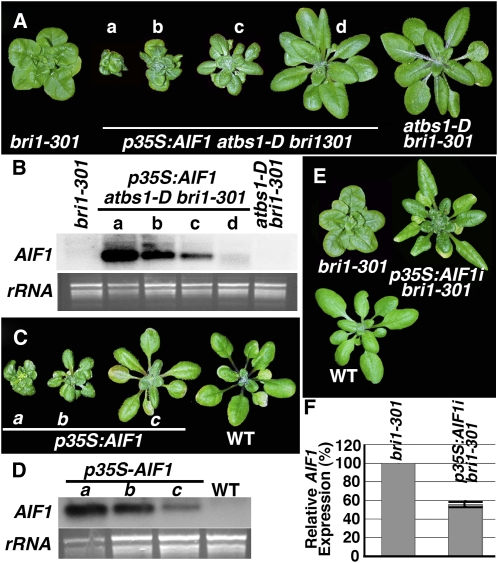
(A) AIF1 overexpression alters the atbs1-D bri1-301 morphology. Shown here from left to right are 6-week-old soil-grown plants of bri1-301, four independent transgenic lines of p35S:AIF1 atbs1-D bri1-301, and the wild type.
(B) RNA gel blot analysis of AIF1 overexpression in plants shown in (A).
(C) AIF1 overexpression in the wild type leads to bri1-like dwarf phenotype. Shown from left to right are 6-week-old soil-grown plants of three independent p35S:AIF1 transgenic lines and the wild type.
(D) RNA gel blot analysis of AIF1 transcript levels in plants shown in (C). For both (B) and (D), 10 μg of total RNAs of each sample were separated by agarose gel, stained with ethidium bromide for a loading control, transferred to nylon membrane, and hybridized with a 32P-labeled AIF1 cDNA fragment.
(E) Silencing of AIF1 expression suppresses the bri1-301 phenotype. Shown here are 6-week-old soil-grown plants of bri1-301, a p35S:AIF1i bri1301 transgenic line, and the wild type.
(F) Real-time qRT-PCR analysis of AIF1 expression in bri1-301 and a p35S:AIF1i bri1-301 line. Total RNAs isolated from 3-week-old seedlings were converted into cDNAs, which were used as templates to amplify transcripts of AIF1 or β-TUBULIN with primers listed in Supplemental Table 2 online. The comparative Ct method was used to calculate the levels of transcripts relative to that of bri1-301 after normalization to the β-TUBULIN control. Bars represent sd (n = 3).
[See online article for color version of this figure.]

