Figure 2.
2D-DIGE of FFZE Separated Tonoplast from M. crystallinum.
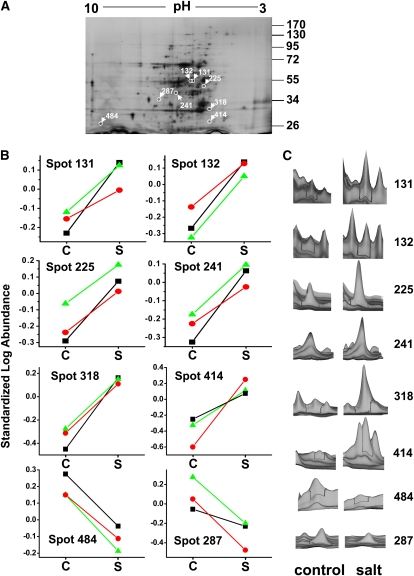
(A) A representative preparative silver-stained gel of tonoplast fractions from salt-treated plants. Protein (200 μg) was separated by isoelectric focusing on 3 to 10 linear immobilized pH gradient strips for the first dimension and by SDS-PAGE on a 10% linear acrylamide gel for the second dimension. Eight protein spots that showed significant changes in abundance between the control and salt-treated tonoplast samples after analysis with Decyder Software (>1.5-fold change, P ≤ 0.05; Student's t test [P ≤ 0.03]; n = 3) are circled and labeled with the software-derived spot number. The positions of PAGE molecular mass markers are shown in kilodaltons on the right of the gel image.
(B) Graphical representation of the standardized log abundance (i.e., log abundance of Cy3- or Cy5-labeled spot over log abundance of Cy2-labeled standard spot). Individual lines show each of the three biological replicates from control (C) and salt (S)-treated tonoplast. Triangles, values from gel 1; circles, values from gel 2; squares, values from gel 3.
(C) The three-dimensional fluorescence intensity profiles of the individual spots shown for one of the biological replicates comparing control and salt-treated profiles of each of the eight protein spots that showed significant changes.
[See online article for color version of this figure.]

