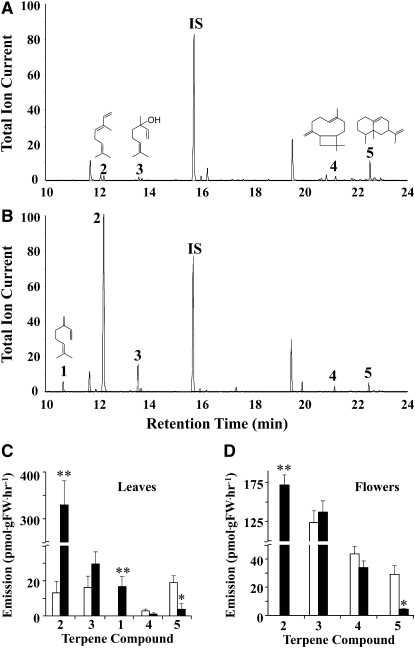
Figure 2.
Effect of Am GPPS.SSU Expression on Terpenoid Emission from Leaves and Flowers of Transgenic Tobacco Plants.
(A) and (B) Metabolic profiling of volatiles emitted from leaves of untransformed control (A) and transgenic GPPS.SSU-1 (B) tobacco plants. Volatiles collected from detached leaves were analyzed by electron ionization GC-MS, and total ion currents are plotted. Compounds were identified based on their mass spectra and retention time: 1, myrcene; 2, (E)-β-ocimene; 3, linalool: IS, internal standard (naphthalene); 4, β-caryophyllene; 5, 5-epi-aristolochene.
(C) and (D) Quantitative changes in terpenoids emitted from leaves (C) and flowers (D) of GPPS.SSU-1 tobacco plants relative to the control. White and black bars represent the amount of terpenoids in the control and transgenic line, respectively. Data are means ± sd (n = 3 to 10). Asterisks indicate values that are significantly different from the control. Confidence levels were tested by a Student's t test; *, P < 0.05; **, P < 0.001.

