Figure 6.
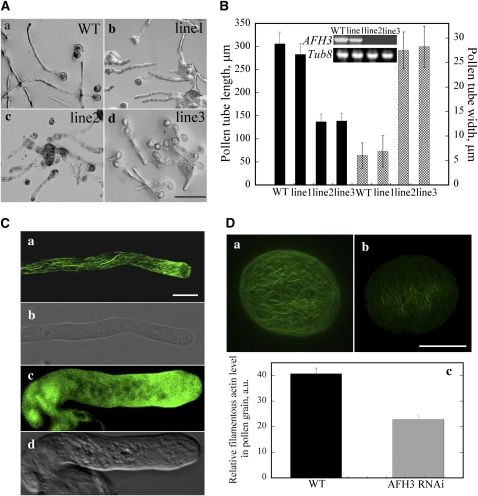
Downregulation of AFH3 Expression Induces the Loss of Actin Cables in the Shank of the Pollen Tube and Consequently Inhibits Its Growth and Increases Its Width.
(A) Pollen tube phenotype typical of those from wild-type plants and different AFH3-RNAi lines after culturing in germination medium for 3 h; (a) wild type; (b) RNAi line 1; (c) RNAi line 2; (d) RNAi line 3. Bar = 100 μm for (a) to (d).
(B) Quantitative analysis of the effect of AFH3 knockdown on pollen tube length and width. Inset: RT-PCR analysis confirms the knockdown of AFH3 transcript in different AFH3 RNAi lines.
(C) Visualization of the actin cytoskeleton in pollen tubes stained with by Alexa-488 phalloindin. The actin cytoskeleton of a wild-type pollen tube (a) and AFH3 RNAi pollen tube (c) was visualized by confocal laser scanning microscopy after staining with Alexa-488-phalloidin. (b) and (d) show the corresponding bright-field images for (a) and (c) pollen tubes, respectively. Bar = 10 μm in (a) to (d).
(D) The filamentous actin level was substantially decreased in the pollen grains of the AFH3 RNAi transgenic plant. The actin cytoskeleton of a pollen grain from wild-type (a) and AFH3 RNAi (b) plants was visualized by confocal laser scanning microscopy after staining with Alexa-488-phalloidin. Confocal settings and image collection and display parameters were identical between pollen grains. Images shown are z-series stacks of all optical sections. Bar = 10 μm. In (c), the average pixel intensity was measured for the pollen grains by confocal laser scanning microscopy. About 100 pollen grains were measured for each genotype, and the mean values (±se) are plotted.

