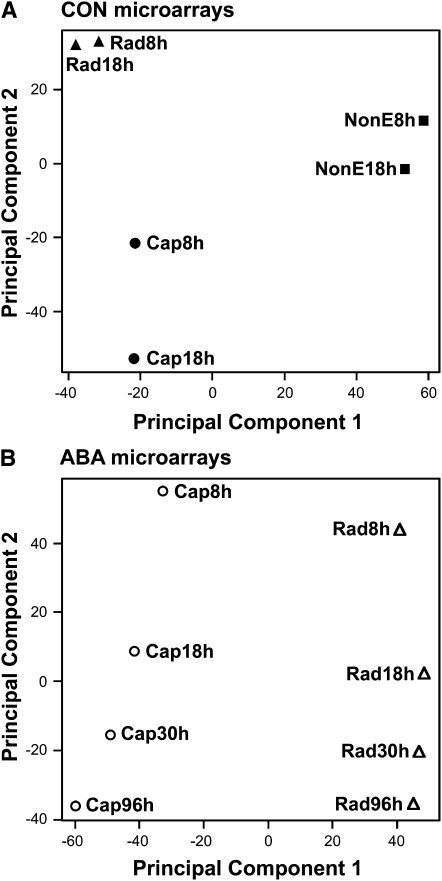
Figure 3.
The Results of PCA Applied to CON and ABA Microarray Data of L. sativum FR1.
(A) PCA was applied to the expression of all informative genes on the CON microarrays (22,025 genes; see Supplemental Data Set 1 online) in various tissues and at various times after the start of imbibition, which is before and near the end of endosperm weakening, respectively (see Figure 1A), to look for global patterns of similarities and differences between the samples. PC1 and 2 accounted for 46 and 26% of the variance in gene expression, respectively.
(B) The results of PCA for the ABA microarrays (19,794 genes; see Supplemental Data Set 2 online) in various tissues and at various times, as indicated. Samples at 8, 18, and 30 h were taken before the start of endosperm weakening, and the sample at 96 h was taken near the end of endosperm weakening and before radicle emergence (see Figure 1A). PC1 and 2 accounted for 42 and 20% of the variance in gene expression, respectively.

