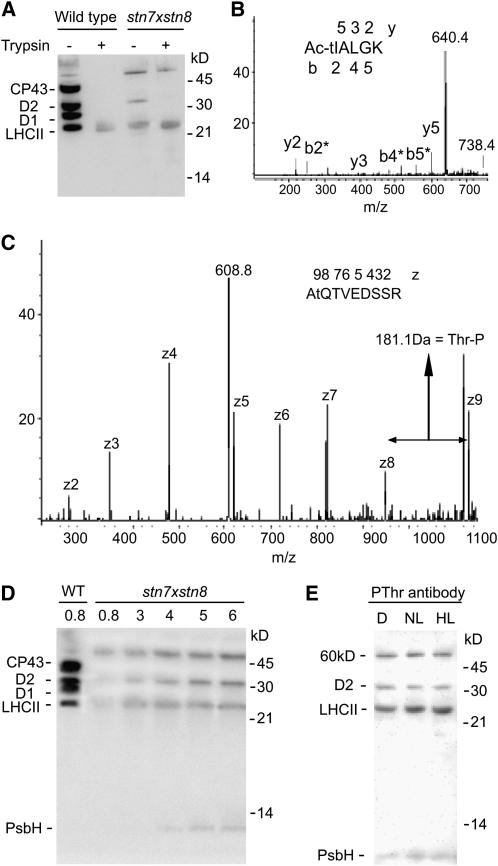
Figure 1.
Phosphorylation of Thylakoid Proteins in stn7xstn8.
(A) Immunoblotting analysis of SDS-PAGE separated thylakoid proteins from wild-type and stn7xstn8 plants with antiphosphothreonine antibody from Zymed Laboratories before (−) and after (+) the treatment of thylakoids with trypsin.
(B) The product ion MS/MS spectrum obtained by collision-induced fragmentation of a singly charged phosphopeptide with m/z = 738.4 (indicated) corresponding to the N terminus of D2 protein from stn7xstn8. The ion indicated at m/z = 604.4 corresponds to the peptide that underwent a neutral loss of phosphoric acid with a mass 98. The fragment ions b (N-terminal) and y (C-terminal) are marked below and above the peptide sequence shown with the phosphorylated and acetylated Thr indicated by the lowercase t and Ac. All b ions in the spectrum are marked with an asterisk because they lost the phosphoric acid.
(C) The product ion MS/MS spectrum obtained by electron transfer dissociation of the doubly charged phosphopeptide with m/z = 608.8 (indicated) corresponding to the N terminus of PsbH protein from stn7xstn8. The z fragment ions are labeled in the spectrum. Note that the mass increment between z8 and z9 is 181 D, which corresponds to the intact phosphorylated Thr residue at the second position from the peptide N terminus and is indicated by the lowercase t in the shown peptide sequence.
(D) Immunoblot with antiphosphothreonine antibodies from New England Biolabs. Thylakoid membrane proteins from wild-type and mutant (stn7xstn8) plants exposed to the normal growth light for 3 h were separated by SDS-PAGE. The membranes containing 0.8 μg chlorophyll were loaded for the wild type, while the samples from stn7xstn8 contained 0.8, 3, 4, 5, and 6 μg chlorophyll, as indicated.
(E) Immunoblot with antiphosphothreonine antibodies from New England Biolabs. The thylakoid membranes were isolated from the stn7xstn8 plants adapted to darkness for 15 h (D), exposed to normal light of 120 μmol photons m−2 s−1 for 3 h (NL), or to high light of 900 μmol photons m−2 s−1 for 3 h (HL). The membranes containing 2 μg chlorophyll were loaded in each lane. The positions of the major phosphorylated proteins and of the molecular markers are indicated in (A), (D), and (E).

