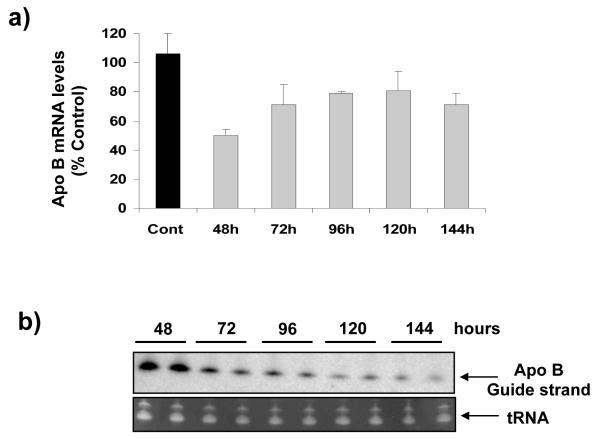
Figure 5. Pharmacokinetics of TOT-siRNA.
(a) Mice were injected with 0.96 mg/kg of TOT-siRNA and ApoB mRNA levels were measured in liver at various times after injection. Values represent the mean ± SD of tissue samples from 3-5 animals, (b) ApoB siRNA decreases with time in livers of mice injected with TOT-siRNA. Mice were injected with TOT-siRNA (a), total RNA was isolated from their livers at various times after injection, and ApoB siRNA guide strand was identified by northern blot analysis. A representative northern blot shows that the amount of ApoB guide strand siRNA decreased over the time range shown. tRNA was Identified as a positive control.

