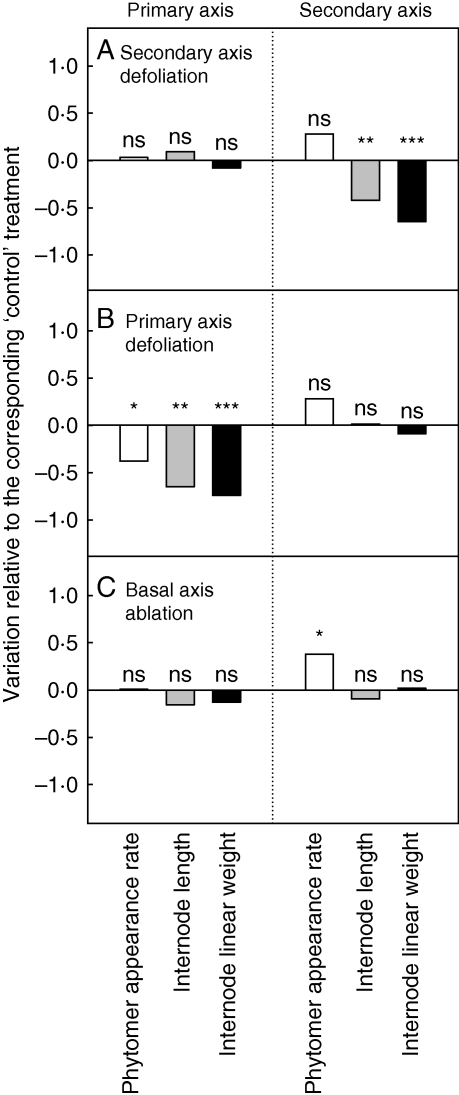
Fig. 5.
Relative phytomer appearance rate, internode length and internode linear weight on primary and secondary axes normalized using the observed values for the corresponding ‘control’ treatments in each experiment for (A) ‘secondary axis defoliation’, (B) ‘primary axis defoliation’, and (C) ‘basal axis ablation’ treatments. ***, Significant at P < 0·001; **, significant at P < 0·01; *, significant at P < 0·05; n.s., not significant.

