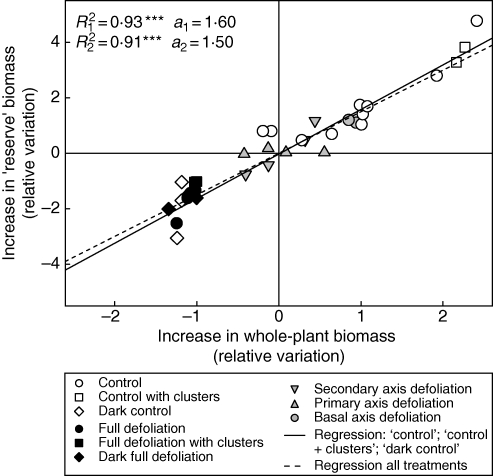
Fig. 7.
Variation around the observed mean values for the increase in reserve biomass (for a description of the variables, see Table 4) as a function of variation around the mean for whole-plant biomass increase. The continuous line represents the linear regression for ‘control’, ‘control with clusters’ and ‘dark control’ treatments and the dashed line represents the same regression for the whole dataset. Each point corresponds to the mean value for the same treatment in each experiment (except expt 6). R12 is the coefficient of determination of the linear regression for the plants subjected to ‘control’, ‘control with clusters’ and ‘dark control’ treatments and R22 is the equivalent coefficient of determination for the whole dataset. a1 and a2 are the slopes of the regression lines. The significance of the regressions was assessed with Pearson's test: ***, significant at P < 0·001; n.s., not significant.

