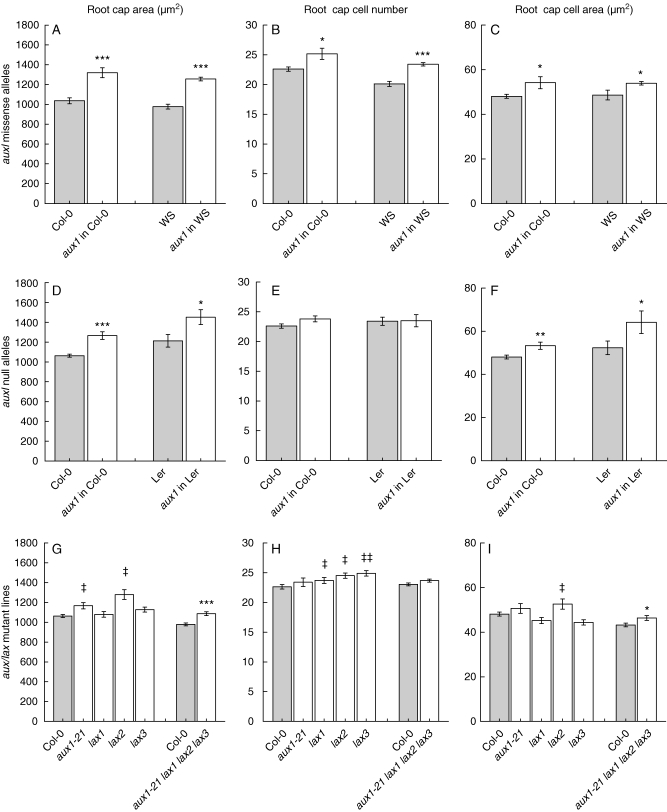
Fig. 4.
aux1 lax effect on embryonic root cap size and cell proliferation. In all cases, n varies between 10 and 100. Shaded bars represent the respective wt accession with which each group was compared. Error bars show the s.e.: *, P < 0·05 t-test; **, P < 0·005 t-test; ***, P < 0·0005 t -test; ‡, P < 0·05 Tukey's post hoc test; ‡‡, P < 0·005 Tukey's post hoc test.

