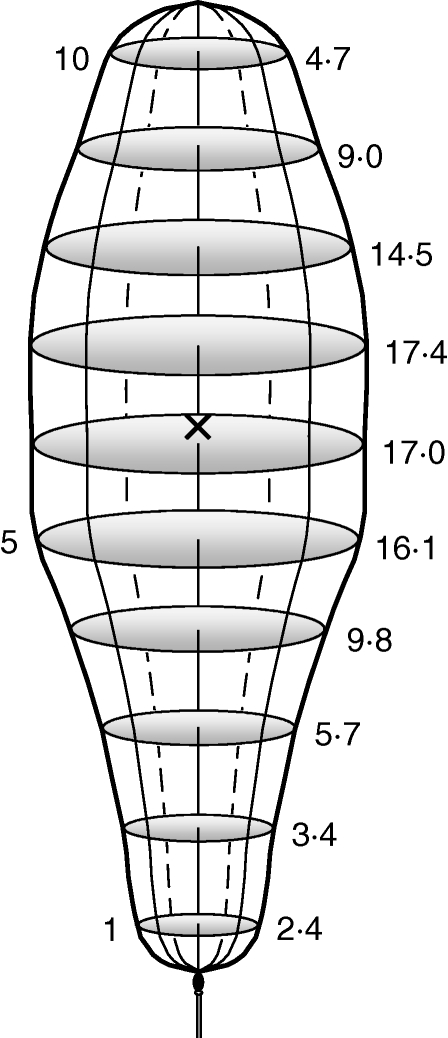
Fig. 3.
The 3D shape of the model Sphagnum spore cloud at the moment (tcen) when as many spores are ascending as descending, with all the normal irregularities and protrusions averaged away. Numbers to the right represent the estimated percentage of spores encountered at each of the ten evenly distributed positions (numbers on the left) along the cloud. The cross indicates the weighted average position (at 56·4 % of the distance from cloud base to summit) of spores, according to the cloud volume.

