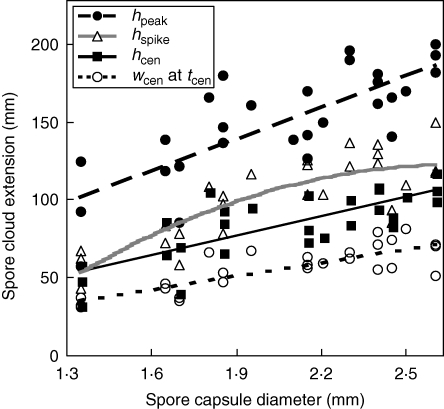
Fig. 4.
Sphagnum spore cloud extensions after discharge in relation to capsule diameter: closed circles and long-dashed line (regression line) represent observations on peak height (hpeak) of the spore cloud; open triangles and grey curved line represent height of the spike (hspike) just after discharge; closed squares and unbroken line represent height of the centroid (the average spore maximum; hcen); open circles and short-dashed line represent horizontal width of the spore cloud (wcen) at the moment of centroid maximum (tcen). The lines are based on the simple models in Table 2, except for hspike that also includes the quadratic relationship to capsule diameter (the only term that showed improved adjusted R2 when including the quadratic directly after the linear relationship).

