Figure 7.
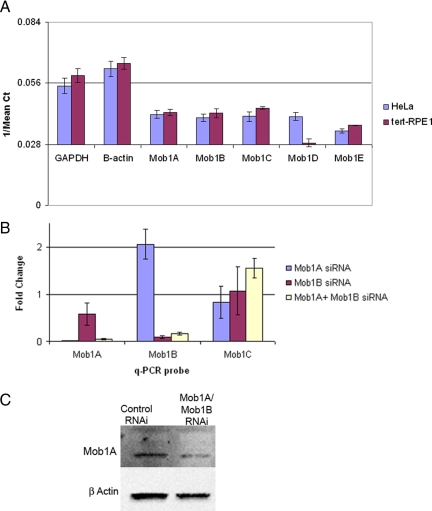
Expression profile and depletion of Mob1 in HeLa and hTERT-RPE1 cells. (A) Quantitative PCR was performed using cDNA from HeLa and RPE1 cells. The graph shows the reciprocal values of Ct on y-axis to represent relative expression of Mob1 isoforms in HeLa and RPE1 cells. Error bars, SD. (B) RPE1 cells were transfected with Mob1A and Mob1B siRNA singly or in combination, and RNA was harvested 48h after transfection. qPCR was performed to determine the transcript levels for Mob1A, -B, and -C (which was not targeted). The -fold changes shown are the means of at least two different experiments done in triplicate. Values between 0.5 and 2.0 were not considered as significant change in gene expression. Error bars, SD. (C) Confirmation of protein depletion was determined by Western blot using an antibody specific for both Mob1A and Mob1B.

