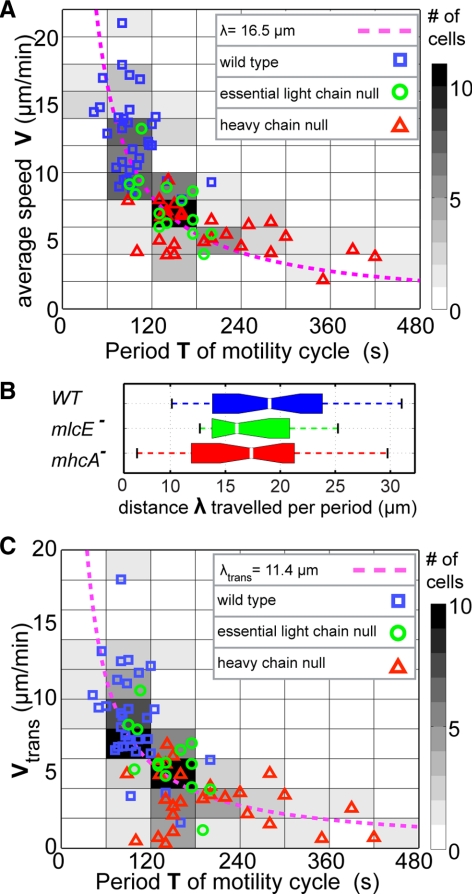
Figure 2.
Dictyostelium motility on gelatin substrates is pace limited. (A) Scatter plot of the average velocity of N = 72 chemotaxing Dictyostelium cells versus the period of their motility cycle (determined from the time evolution of L). The data points come from three different cell lines: N = 31 wild-type cells (blue squares), N = 14 mlcE− cells (green circles), and N = 27 mhcA− cells (red triangles). The dashed magenta hyperbola (V = λ/T) is a least square fit to the data, yielding λ = 18 μm. The V − T plane has been divided into tiles that have been colored according to the number of cells whose speed and motility period lie within each tile. Darker tiles contain more cells, as indicated in the color. (B) Box plot of the product V·T for wild-type, mhcA−, and mlcE− cells. (C) Scatter plot of the continuous translocation velocity Vtrans (see Eq. 3) of the same cells as in A versus the period of their motility cycle. The dashed magenta hyperbola (Vtrans = λ/T) is a least square fit to the data, yielding λ = 12 μm.

