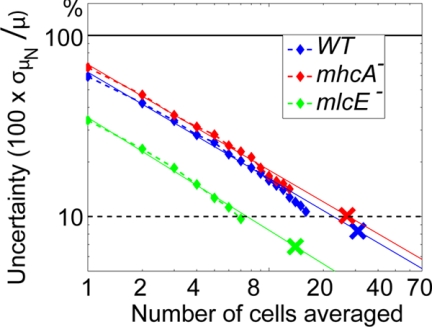
Figure 4.
Percentage of error (two-dimensional L2 norm) of the phase averaged traction fields as a function of the number of cells compiled in the statistics. Blue, wild-type cells; red, mhcA− cells; green, mlcE− cells. The plots show the standard deviations, σμN, of the distributions of phase-averages μN obtained for all possible combinations of N cells that can be formed within a population of NTOT > N cells. The results are normalized with the total average, μNTOT, and represented as a function of N. The straight lines are projections of the data from each cell strain. The color crosses on the projections correspond to N = NTOT (NTOT = 31, 14, and 27 for wild-type, mlcE−, and mhcA− cells, respectively). These crosses therefore estimate the uncertainty of the phase averages in Figure 5.

