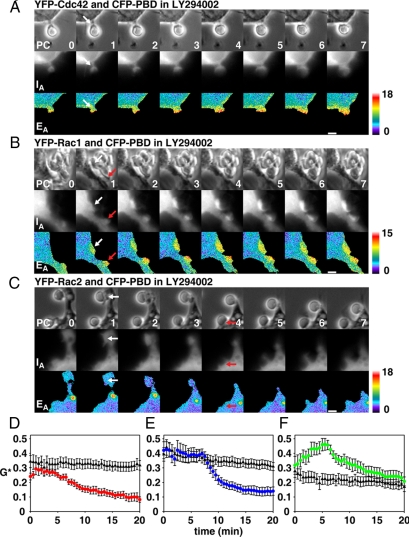
Figure 1.
Activation of Rho GTPases in phagocytic cups after LY294002 inhibition. Activation of YFP-Cdc42 (A), YFP-Rac1 (B) and YFP-Rac2 (C) was measured by FRET microscopy in LY294002-treated macrophages during phagocytic cup formation around IgG-opsonized erythrocytes. (A–C) The image series show phase-contrast (PC), YFP-Cdc42/Rac (IA), and pseudocolored EA images indicating GTPase activation. White and red arrows indicate phagocytic cups. Scale bars at bottom right, 3 μm. Numbers in the bottom right of the PC images indicate the time in minutes after binding of the first erythrocyte. EA values of pseudocolor images in A–C correspond to G* values of 0.74, 0.68, and 0.97, respectively. (D–F) GTPase activation in LY294002-treated macrophages (▴) was quantified and compared with activation by control macrophages (colored circles) (D) Cdc42, (E) Rac1, (F) Rac2. For each plot, n = 10–13 sequences. Error bars, (D–F) ±SEM.

