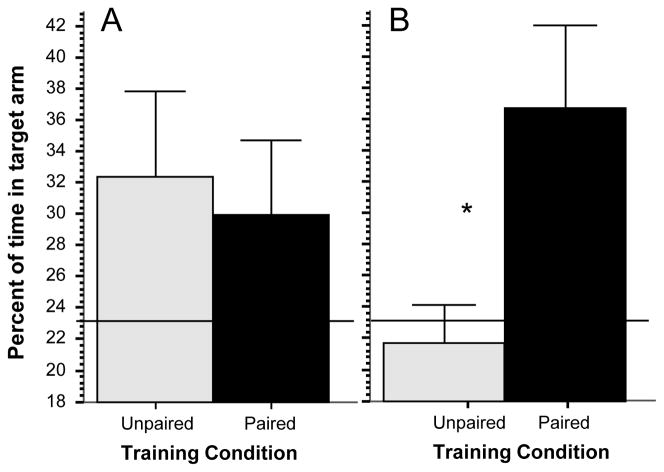
Figure 5.
Spatial learning: Percent of time in the target arm significantly differs between the groups at the probe trial. Panel A, performance at the first training trial. Panel B, performance at the probe trial, i.e. after 20 training trials. Mean ± SEM are shown. Sample sizes nunpaired = 10, npaired = 12. The solid horizontal line represents random chance level performance. Significant difference (p < 0.05) between the groups is indicated by an asterisk. For methodological details see Methods. For details of statistical analyses, see Results.

