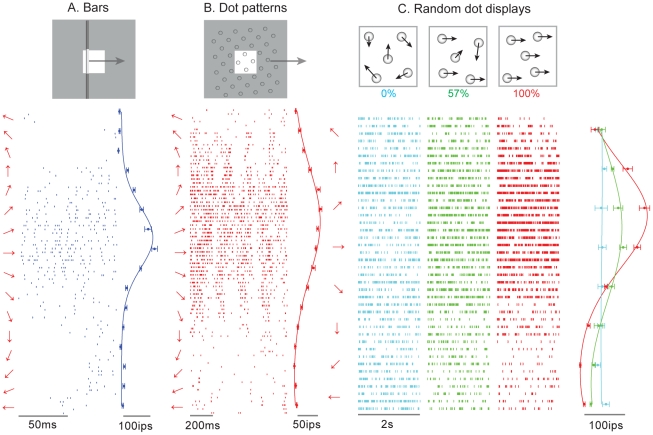
Figure 1. Responses of a neuron in area 1 to (A) bars (DI = 0.42), (B) dot patterns (DI = 0.54), and (C) random dot displays (DI = 0.52 at 100% coherence) presented to the monkey's fingertip.
The stimuli are illustrated as insets at the top: for bars and dot patterns, the white square shows the area (1 cm×1 cm) across which the stimuli are scanned; the gray region illustrates the stimulus extending outside of the stimulation area. The left of each raster is the direction of motion of the stimulus. To the right of each raster is the mean firing rate evoked by stimuli moving in each direction. This neuron produced the most robust response to stimuli moving at approximately 20°, regardless of whether the stimuli were bars, dot patterns, or random dot displays. For random dot displays, the direction tuning increased dramatically with increases in the motion coherence (we show responses at only three levels of coherence for the sake of clarity). The “burstiness” of the response to dot patterns likely reflects individual dots moving across the neuron's hotspot.

