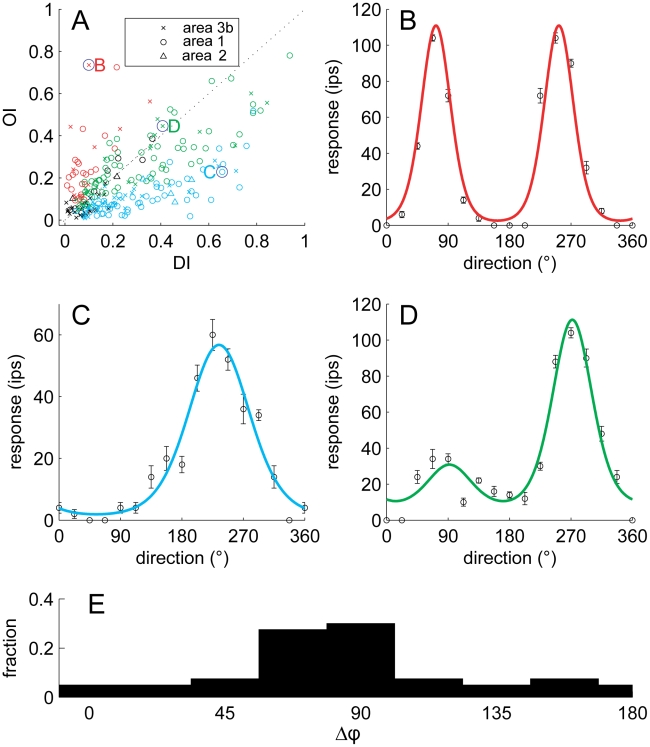
Figure 5. Orientation sensitivity and direction sensitivity.
(A) Orientation selectivity index (OI) versus direction selectivity index (DI) for neurons in areas 3b (crosses), 1 (circles), and 2 (triangles). Red symbols represent neurons that yielded significant OIs, blue symbols represent neurons that yielded significant DIs, and green symbols represent neurons for which both indices were significant; black symbols represent neurons for which neither index was significant. (B) Responses of a neuron that yielded a high OI and a low DI (marked as a B in the upper left quadrant of the scatterplot); red trace is a fitted von Mises function (circular Gaussian); (C) responses of a neuron that yielded a high DI and a low OI (marked as a C in the lower right quadrant); blue trace is a fitted von Mises function; (D) responses of a neuron that yielded intermediate values for both the OI and the DI (marked as a D around the center); green trace is the product of two von Mises functions; (E) Distribution of the angular difference between the preferred direction (measured from dot patterns) and the preferred orientation (measured from indented bars) of neurons in area 1. For orientation, 90° and 270° denote bars parallel to the long axis of the finger, and 0° and 180° denote bars orthogonal to the long axis of the finger. The preponderance of neurons that are sensitive to orientation and direction of motion respond to contours moving in a direction perpendicular to their orientation.

