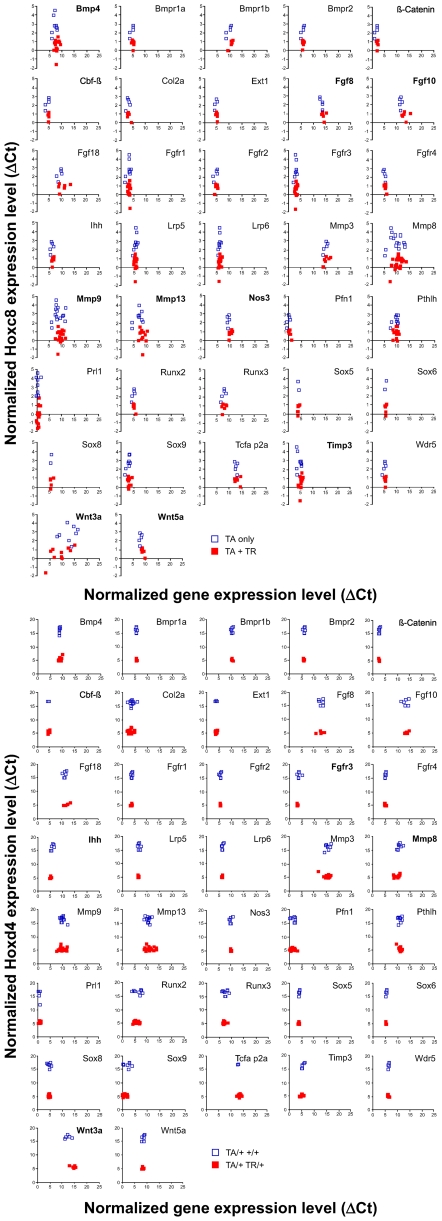
Figure 1. Gene expression in Hoxc8- and Hoxd4-transgenic chondrocytes.
Quantitative real-time PCR was performed in triplicate on cDNA prepared from mRNA that was isolated from primary rib chondrocytes. Rib cages were dissected at 18.5 days of gestation from individual Hoxc8- (A) and Hoxd4- (B) transgenic mouse embryos. Gapdh cDNA levels in each sample were used to standardize measurements. The results are plotted as Gapdh-normalized ΔCT values for each gene relative to Gapdh-normalized Hoxc8 or Hoxd4 gene expression (ΔCT) in each sample. Low ΔCT values reflect higher relative expression levels, and high ΔCT values reflect low relative levels of gene expression. Each dot represents an individual animal (filled symbol = TR-containing samples, open symbol = controls). Bold panel labeling indicates statistical significant differences in expression levels between transgenic and control groups.

