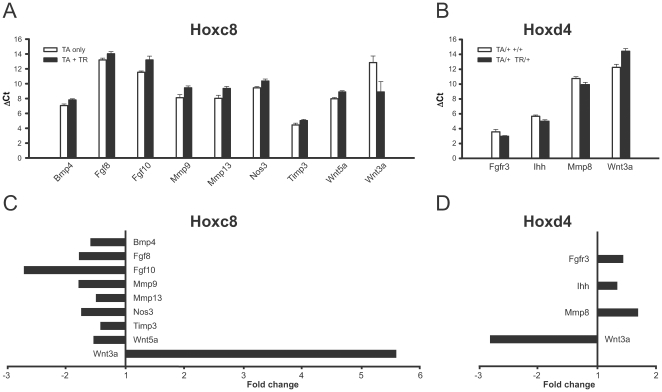
Figure 2. Altered gene expression levels in Hoxc8- and Hoxd4-transgenic cartilage.
ΔCT values (normalized to endogenous control Gapdh) were averaged for each investigated gene over the control group as well the Hoxc8-transgenic group (A,C) and the Hoxd4-transgenic group (B,D), respectively, and are plotted as mean ± standard error of the mean (SEM). Student's T-test was performed to confirm statistical significance (p<0.05). Higher ΔCT values were found for Bmp4, Fgf8, Fgf10, Mmp9, Mmp13, Nos3, Timp3, and Wnt5a (A, filled bars) in Hoxc8-transgenic animals, indicating lower expression levels compared to littermate controls (A, open bars). Wnt3a expression was higher (lower ΔCT value) in Hoxc-transgenic chondrocytes compared to controls. Lower ΔCT values were found for Fgfr3, Ihh and Mmp8 (B, filled bars) in Hoxd4-transgenic animals, indicating higher expression levels compared to littermate controls (B, open bars). Wnt3a expression levels are lower in Hoxd4-transgenic chondrocytes (higher ΔCT value) compared to the control group. Figures C and D present the relative fold-change using the comparative CT method based on amplification efficiency for each gene (see Methods), respectively.

