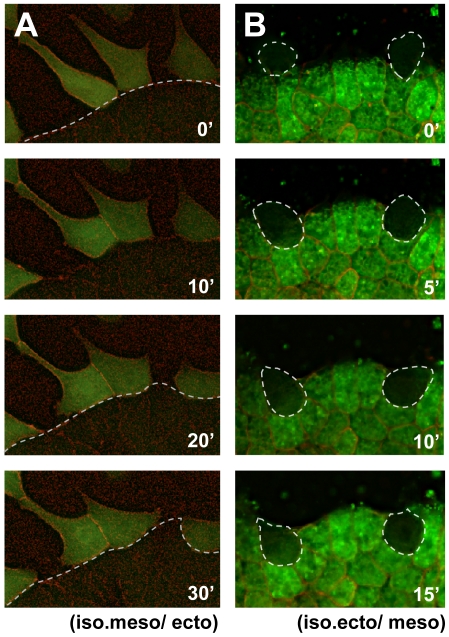
Figure 2. The cell mass is required for the intracellular calcium increase in chordamesodermal cells.
(A) Single frames picked from the time-lapse analysis of calcium dynamics in isolated single chordamesodermal cells (G-CaMP (green cytoplasm) and membrane RFP (red)) upon their attachment to ectodermal tissue (below the dotted line, membrane RFP) taken by each 40 seconds. (B) Calcium dynamics of the chordamesodermal tissue (Fluo 4-AM (green cytoplasm) and membrane RFP (red)) when isolated single ectodermal cells (surrounded by a dotted line) were attaching to it. The same experiments were performed using G-CaMP. They did not show the active signals in either (A) or (B). (iso.meso: isolated chordamesoderm, ecto: ectoderm, iso.ecto: isolated ectoderm, meso: chordamesoderm).

