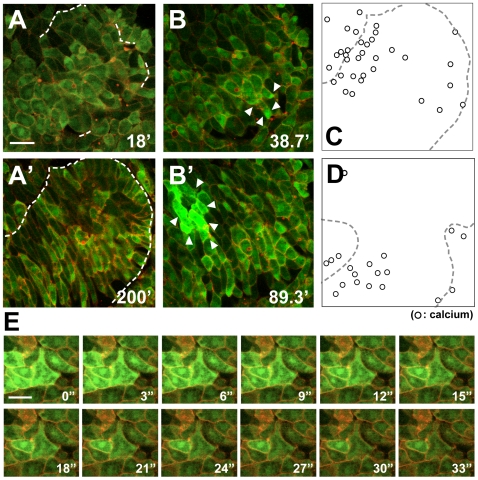
Figure 5. Calcium signals in the notochord-somite boundary area.
(A, A′) Single frame picked from the time-lapse analysis of CE in the DMZ taken by each 40 seconds (Movie S10). The cells were rounded at st. 11.5 – 12, and the boundary was partially visible (A). The cells elongated and intercalated with each other to form the notochord after about 3–4 hours, and the boundary was clearly formed (A′). (B, B′) Single frames picked from the same movie as (A) and (A′). The calcium signals near the boundary indicated by an arrowhead. (C) Locus of the cells in the last frame that showed calcium increase during (A) to (A′) were indicated by dots. The dotted line indicates the boundary at stage (A′). (D) Another explants showing the same tendency as (C). (E) The sequential shots from time-lapse movie of calcium signals in DMZ taken by each 3 seconds. (bar: 50 µm).

