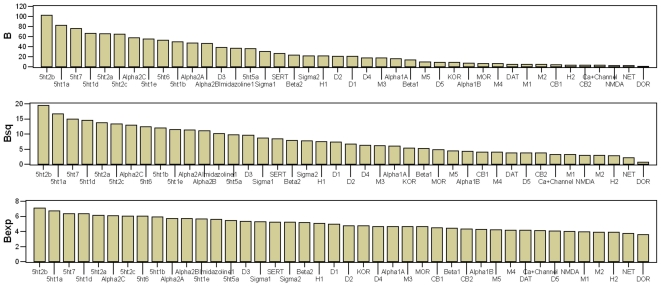
Figure 5. Forty-two receptors arranged in order of decreasing interaction with the full set of thirty-five drugs.
The forty-two receptors are arranged in order of decreasing interaction with the full set of thirty-five drugs, based on the breadth statistics, B, Bsq. and Bexp. The receptors with the greatest interactions are found at the left of the figures, and the receptors with the least interactions are found at the right of the figures. The black vertical bars represent a 100-fold drop in affinity relative to the receptor with the highest affinity at each drug. As a rule of thumb, this is presumed to be the limit of perceptible receptor interaction. Drugs to the right of the black bar should have imperceptible interactions with the receptor, while drugs to the left of the black bar should have perceptible interactions with the receptor, increasingly so the further left they are.

