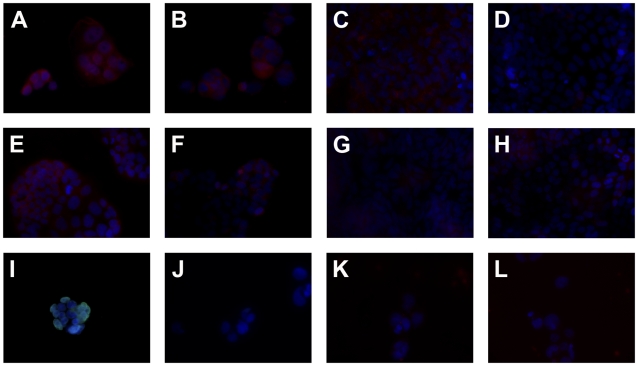
Figure 6. Abundant surface and cytoplasmatic FcεRI α-chain expression only in subconfluent human intestinal tumor cell lines.
Immunofluoresence staining for (A–H) FcεRIα is performed in (A, B) subconfluent and (C, D) confluent Caco2/TC7 as well as in (E, F) subconfluent and (G, H) confluent HCT-8. Triton-X-100 permeabilized (A, C, E, G) and untreated cells (B, D, F, H) were compared. (I–L) Representative control staining in subconfluent Caco2/TC7 with the (I, J) anti-lamin A/C or (K, L) unspecific murine IgG2b, (I, K) permeabilized or (J, L) untreated. The blue fluorescence DAPI staining indicates the nuclei. Original magnification ×40.

