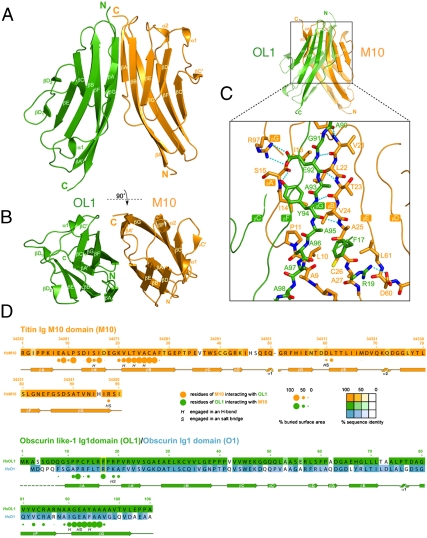
Fig. 1.
(A and B) Cartoon representation of the M10-OL1 heterodimer. As indicated, the view in (B) is rotated by 90 degrees around the x axis compared to the view in (A). M10 and OL1 are shown in orange and green, respectively. (C) Enlarged view of the boxed overall representation shown in the top panel highlighting important M10-OL1 interactions. Some structural elements in the overall representation are shown partly transparent to highlight the mixed intermolecular β-sheet. Color coding for carbon atoms is orange and green for M10 and OL1, respectively; nitrogen, blue; oxygen, red; sulfur, yellow. Hydrogen bonds are dotted cyan lines. (D) Sequence and secondary structure of the M10 and OL1 domains. The sequence of the O1 domain is also given. Amino acids are color-coded according to sequence conservation as highlighted by the conservation bar. Colored circles show residues of one domain contacting the other as indicated in the inset. The radius of the circles is proportional to the buried area percentage as calculated by PISA (34). The letter codes H and S indicate residues involved hydrogen bonds and salt bridges, respectively. Figures were generated with Pymol (www.pymol.org) and Adobe Illustrator.

