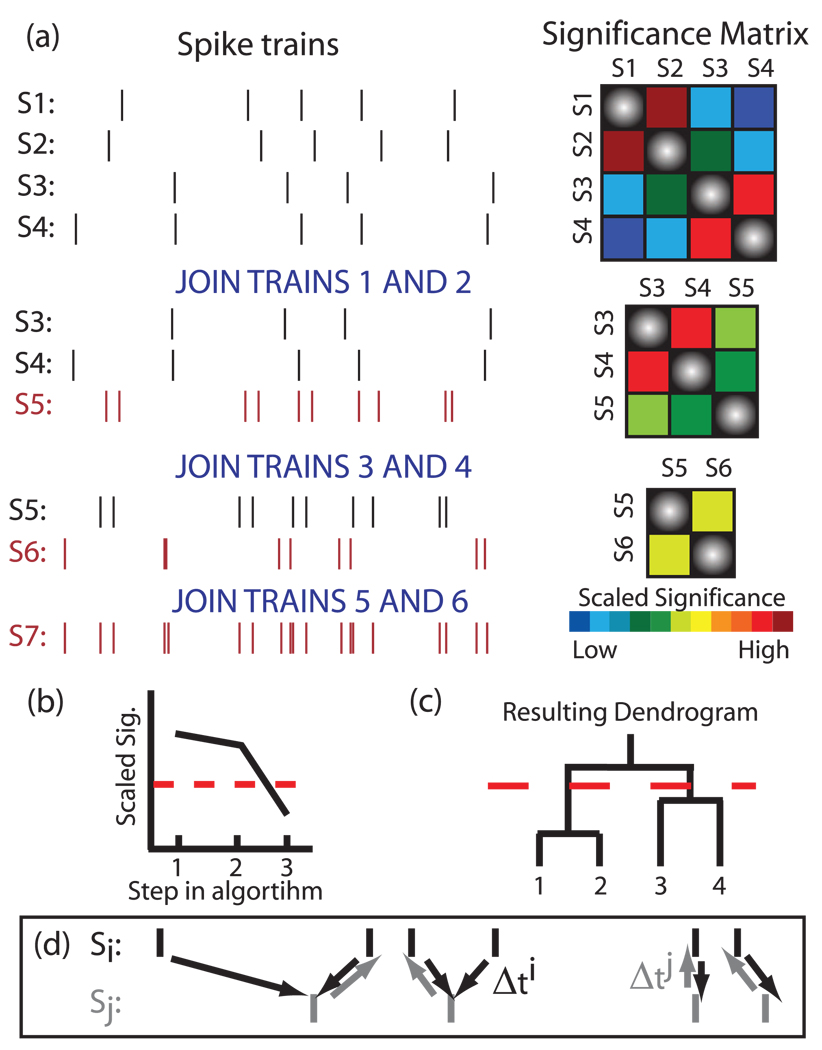
FIG. 1.
(Color) Functional clustering algorithm. (a) An example of the algorithm applied to four spike trains. Two trains are merged in each step by selecting the pair of neurons with the highest scaled significance value and effectively creating a new neuron by temporally summing their spike trains. The procedure is repeated until one (complex) spike train remains. (b) We cease clustering when the trains being grouped are no longer significant; here the dotted red line denotes the significance cutoff. (c) The subsequent dendrogram obtained from the FCA. The dotted line denotes the clustering cutoff. (d) Schematic of the average minimum distance between spike trains.

