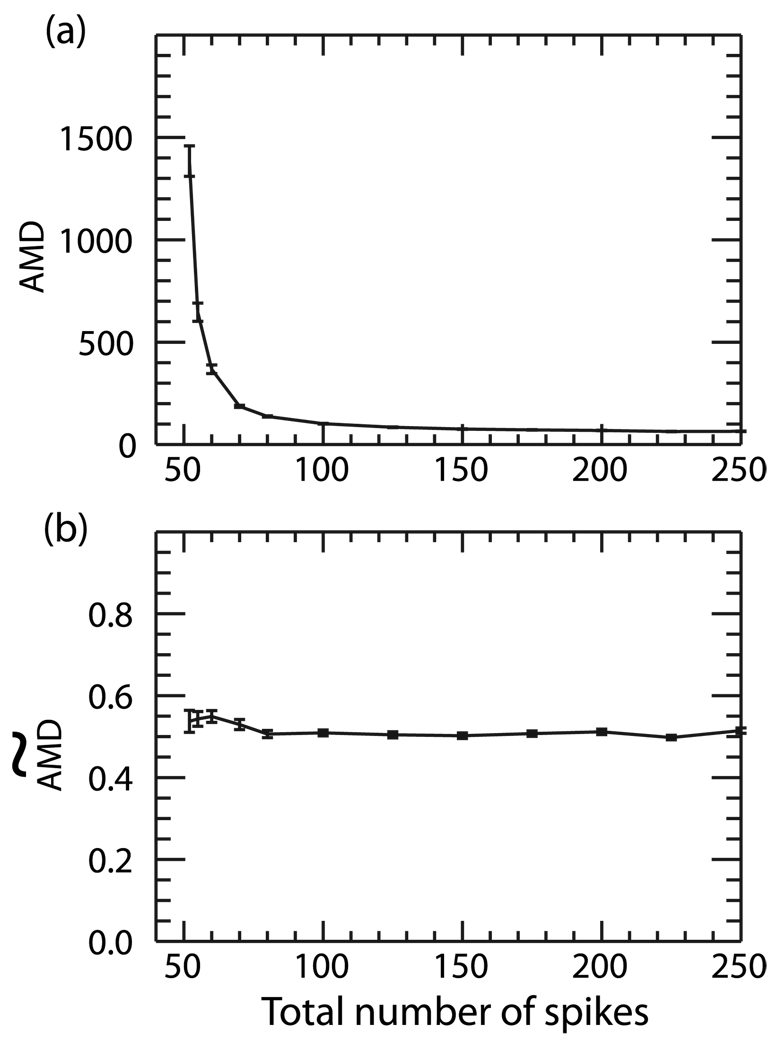
FIG. 2.
(a) AMD and (b)  calculated between two random Poisson trains as a function of the total number of spikes in the trains. One spike train contained a constant number of 50 spikes while the spiking frequency in the other was varied between 2 and 200 spikes. While the AMD scales with the number of spikes in the trains, the
  remains constant as the number of spikes is varied.

