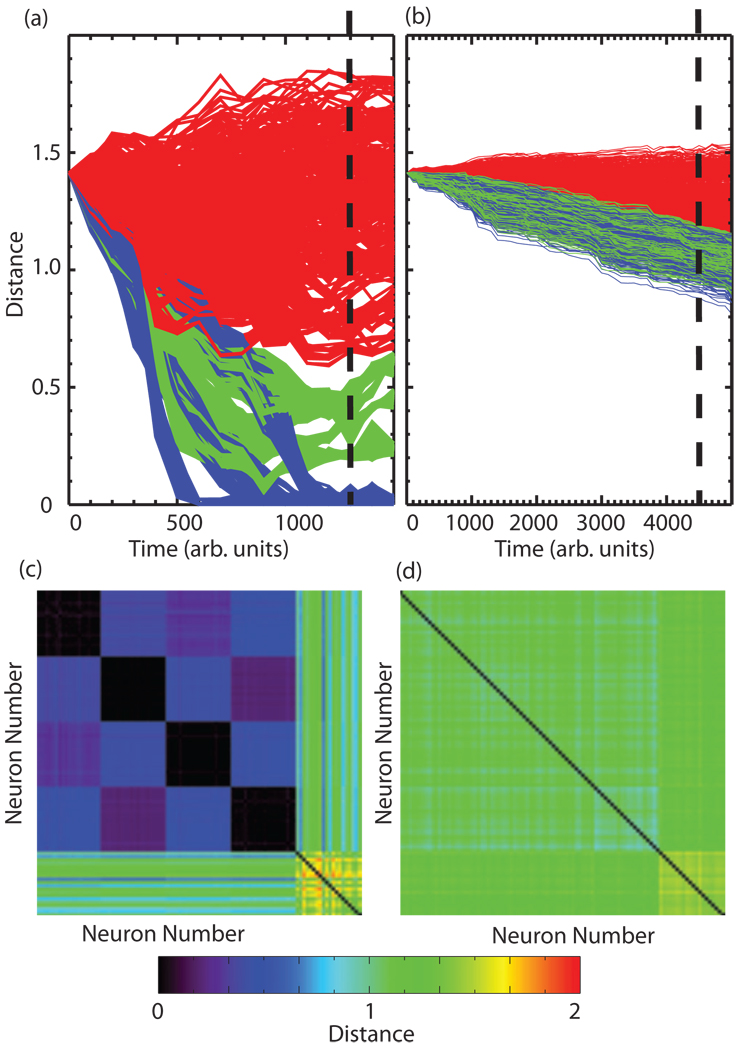
FIG. 4.
(Color) Application of the gravitational method to simulated data. [(a) and (b)] Pairwise distances as a function of time in the stimulation for high correlation within clusters (a) and low correlation within clusters (b). Blue traces: intracluster distances; green traces: intercluster distances; and red traces: distances between any train and an independent train. [(c) and (d)] Matrix version of distances for the point in time denoted by the dashed vertical line in (a) and (b), respectively. Note that for the low correlation case, one cannot detect the formation of individual clusters.

