FIG. 8.
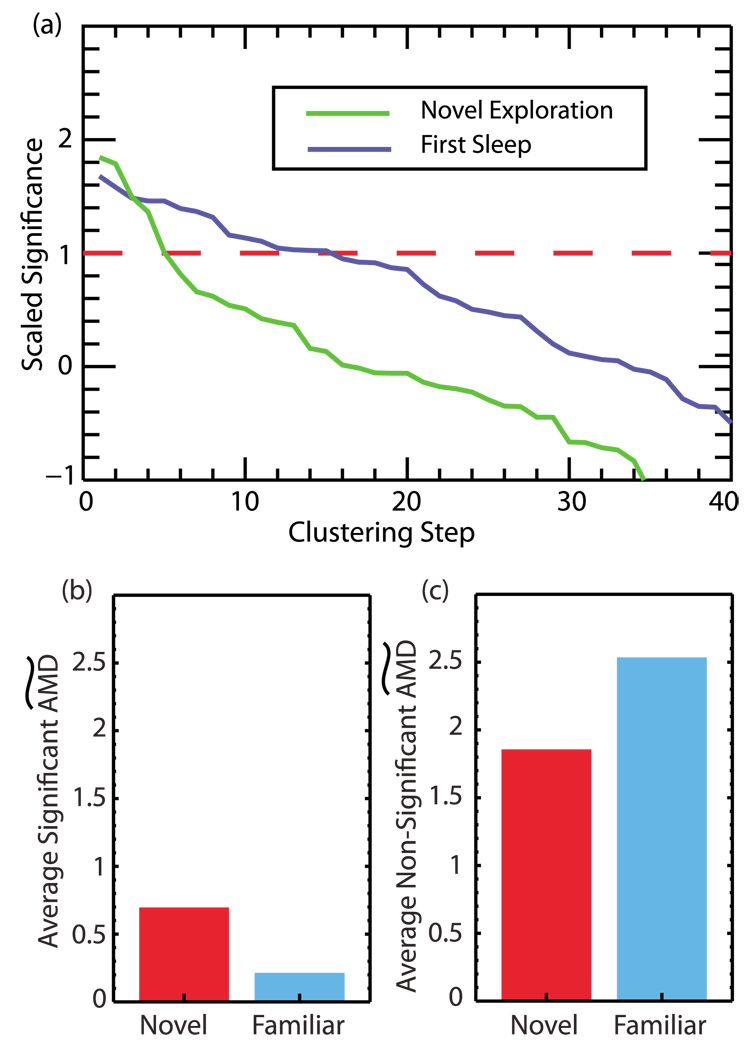
(Color online) (a) The scaled significance used in clustering calculated for novel exploration (0–200s) and the first sleep period (900–1100s). The significance cutoff is shown by the dashed line. The FCA is able to detect the greater number of neurons involved in joint firing known to occur during sleep. (b) Comparison of the  averaged over significant clustering steps from novel exploration and a subsequent familiar exploration. We observe a decrease in this value during the familiar exploration as correlations between neurons become tighter. (c) Comparison of the
  distances averaged over nonsignificant clustering steps during novel and familiar exploration. Here we see an increase in this value during familiar exploration as neurons which were uncorrelated become further decorrelated.

