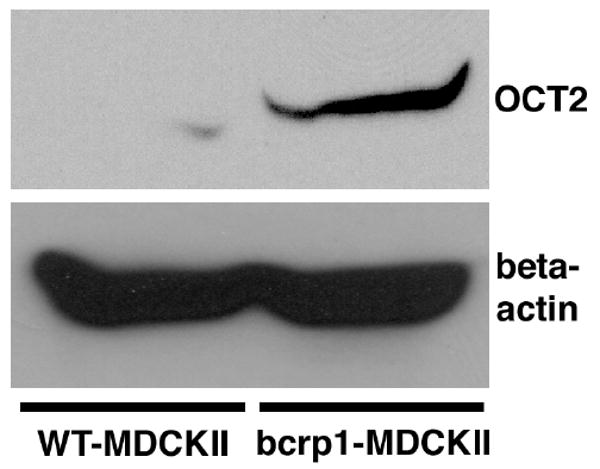
Figure 6. OCT2 protein expression in WT- and bcrp1-MDCKII cells.

Western blotting was used to investigate OCT2 protein expression in MDCKII cells. (Top) Left: OCT2 band in wild-type MDCKII cells; Right: OCT2 band in bcrp1-MDCKII cells. (Bottom) Left: beta-actin band in wild-type MDCKII cells; Right: beta-actin band in bcrp1-MDCKII cells. OCT2 protein expression was ∼ 3.5-fold higher in bcrp1-transfected cells than in wild-type cells. Two different total protein concentrations (35 and 175 μg/well) were analyzed individually, with similar findings in each.
