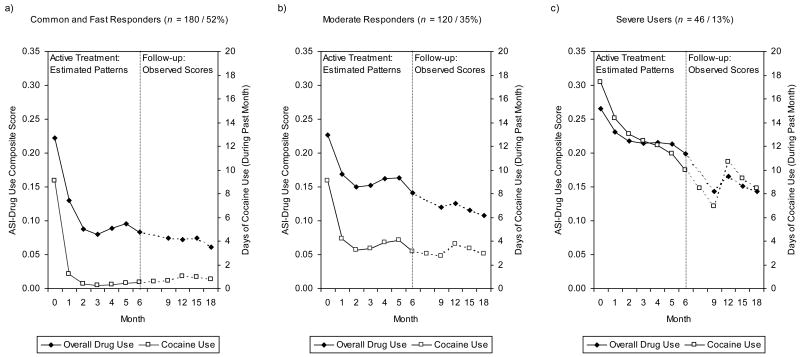
Figure 1.
Typical Patterns of Change in Overall Drug Use and in Cocaine Use in the Three Patient Subgroups: (a) Common and Fast Responders, (b) Moderate Responders, and (c) Severe Users. The Left Half of Each of the Figures Shows the Estimated Mean Latent Growth Trajectories of the Monthly Assessments During the 6-Month Active Phase Treatment, the Right Half of Each of the Figures Shows the Observed Outcomes at the Follow-Up Assessments 9, 12, 15 and 18 Months After the Randomization. The y-Axes on the Left Refer to Overall Drug Use (ASI–Drug Use Composite Scores), Those on the Right to Cocaine Use (Number of Days Using Cocaine During the Past Month).
Note: Overall drug use was measured by the Addiction Severity Index (ASI)–Drug Use Composite Score, cocaine use by the ASI item counting the number of days using cocaine during the past 30 days.

