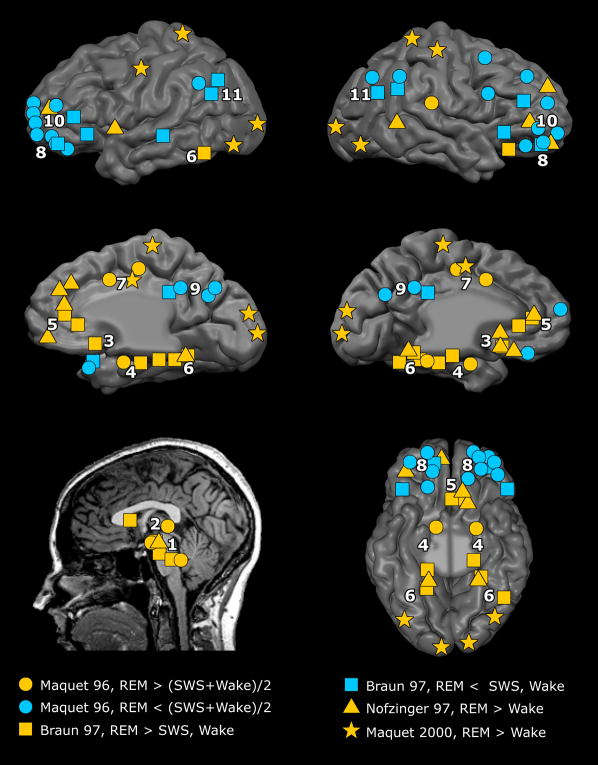
Figure 1. Functional neuroanatomy of human REM sleep: a meta-analysis of PET results.
Meta-analysis of relative increases and decreases in neuronal activity during REM sleep as seen with PET imaging using H215O measurements of regional cerebral blood flow (rCBF) [15, 16, 19] or [18F]-flurodeoxyglucose measurements of glucose metabolism[17]. Top row: cortical surface, lateral view. Middle row: cortical surface, medial view. Bottom row: subcortical foci (left) and ventral view of cortical surface (right). Analysis is based on published Talairach coordinates of foci whose activity was significant at p<0.001 corrected (Z-score > 3.09). Circles, squares, triangles, and stars denote activity foci as reported by [15] (Maquet 96), [16] (Braun 97), [17] (Nofzinger 97), and [19] (Maquet 2000), respectively. Each symbol marks a region’s center-of-mass regardless of its spatial extent. Yellow symbols denote increased regional activity in the (1) mesopontine tegmentum and midbrain nuclei, (2) thalamus, (3) basal forebrain and diencephalic structures, (4) limbic MTL structures including amygdala and hippocampus, (5) medial prefrontal cortex, (6) occipito-temporal visual cortex, and (7) anterior cingulate cortex. Cyan symbols denote decreased activity in the (8) orbitofrontal cortex, (9) posterior cingulate and precuneus, (10) dorsolateral prefrontal cortex, and (11) inferior parietal cortex.

