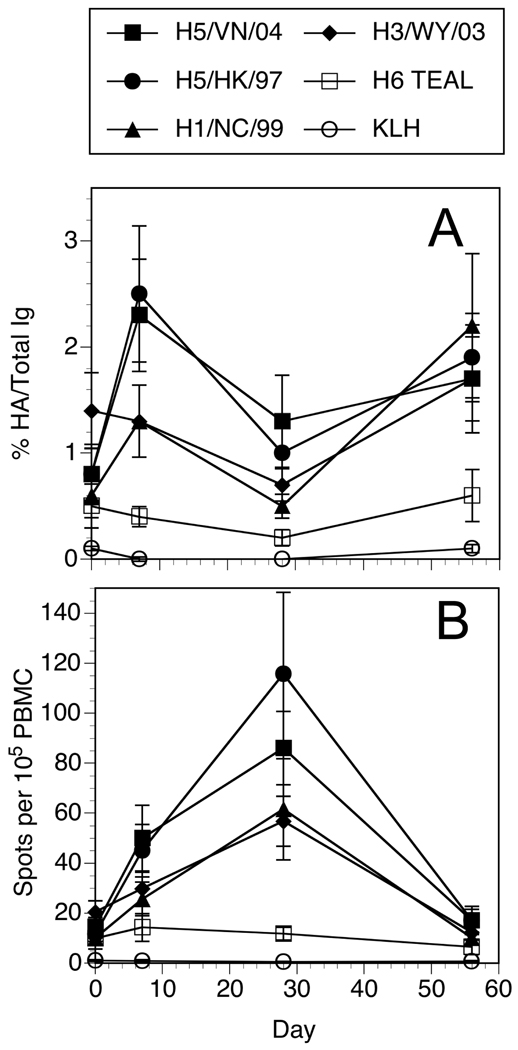
Figure 2. Average frequencies of influenza HA specific B cells from H5 re-vaccinated subjects.
Data from the B cell ELISPOT results of all the subjects for each HA or control antigen were averaged for each time point. Error bars indicate standard error of the mean. A. The data was normalized by taking the number of HA spots and dividing by the number of total IgG spots at a given dilution, then multiplied by 100 to give a value percent HA per Total IgG. B. The total number of HA spot forming cells collected from the cultures were calculated and divided by the number of PBMC originally placed into the mitogen cocktail at the start of the culture to give a frequency of specific cells per 105 PBMC.

