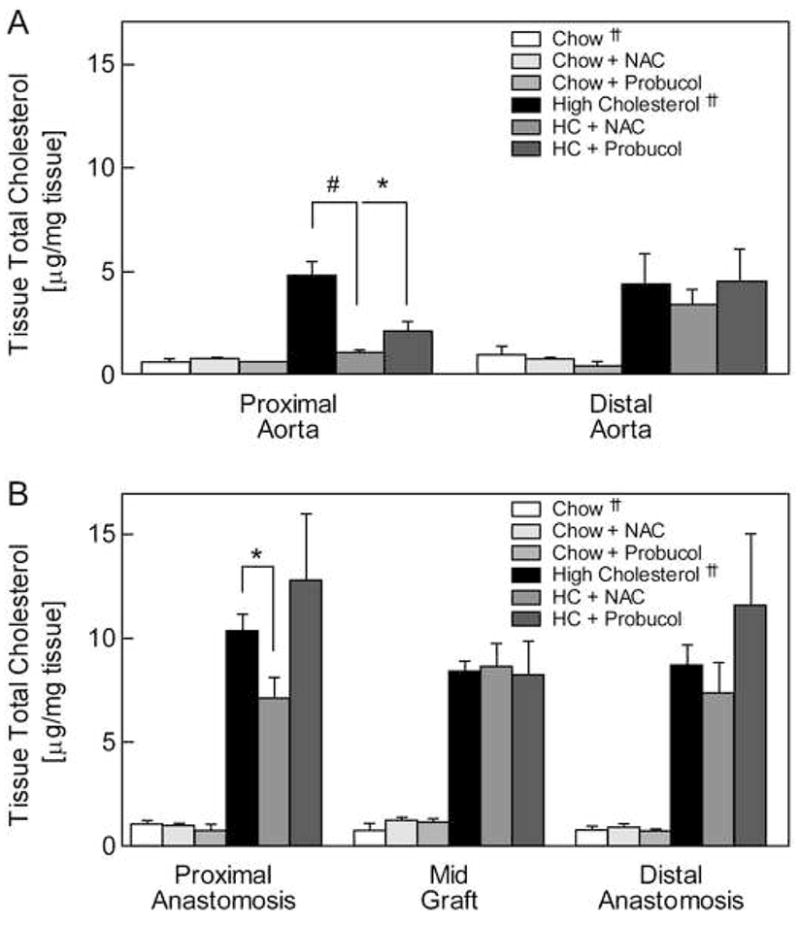
Fig. 1.

Tissue cholesterol content. Lipids were extracted from aortic (A) and graft (B) samples and tissue cholesterol levels were determined using high-performance liquid chromatography. Levels are reported as μg/mg tissue (wet weight) and expressed as the mean ± standard error for each tissue segment and rabbit group: chow (n = 3), chow plus NAC (n = 2), chow plus probucol (n = 3), high cholesterol (HC, n = 3), HC plus NAC (n = 3), and HC plus probucol (n = 3). * P < .05, # P < .005. †† Data from reference 10
