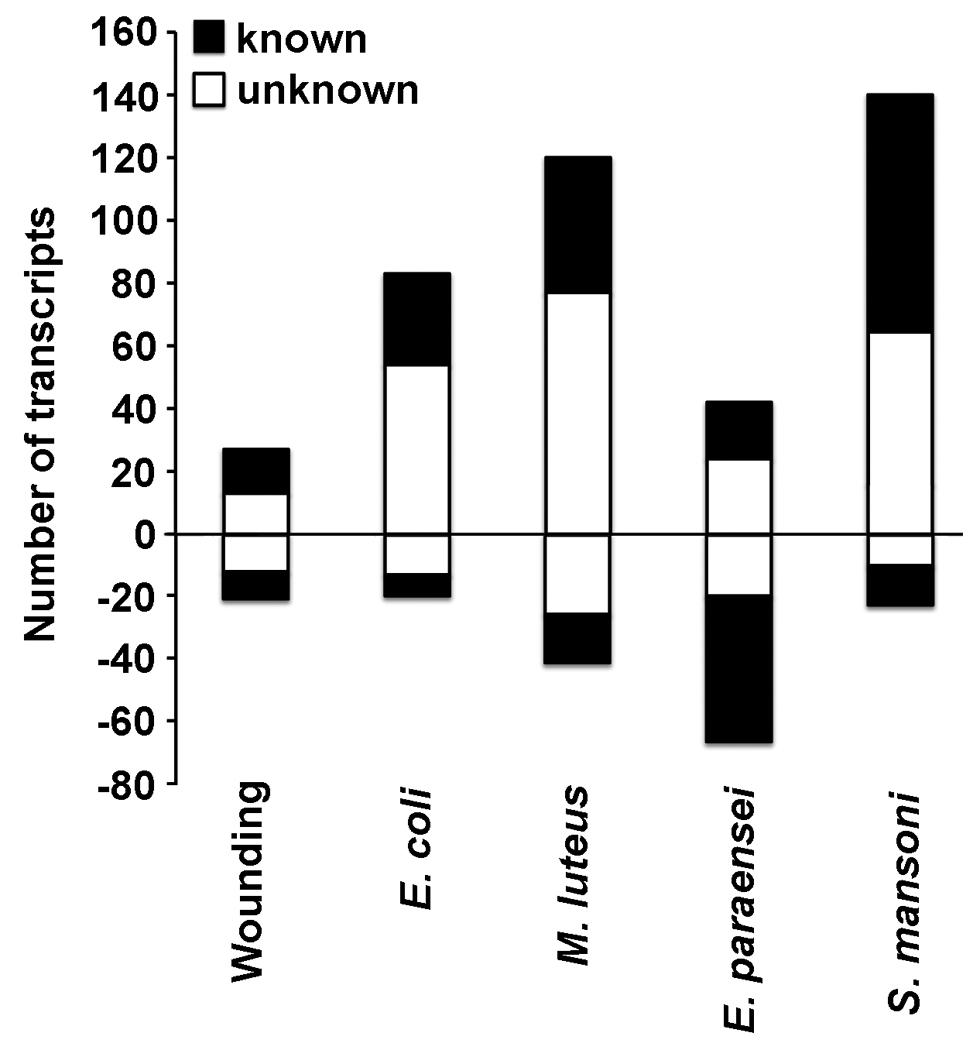
Figure 2. Transcriptional responses of B. glabrata to experimental challenges.

The number of features that were up- or down-regulated at 12 hours after challenge is shown for each experimental treatment. False Positive Rate ≤ 10%. Features with a (putative) ID are numbered in black bars, white bars indicate unknown (novel) sequences.
