
Figure 4. Comparison of transcription profiles of B. glabrata after challenge with bacteria or digenetic trematodes.
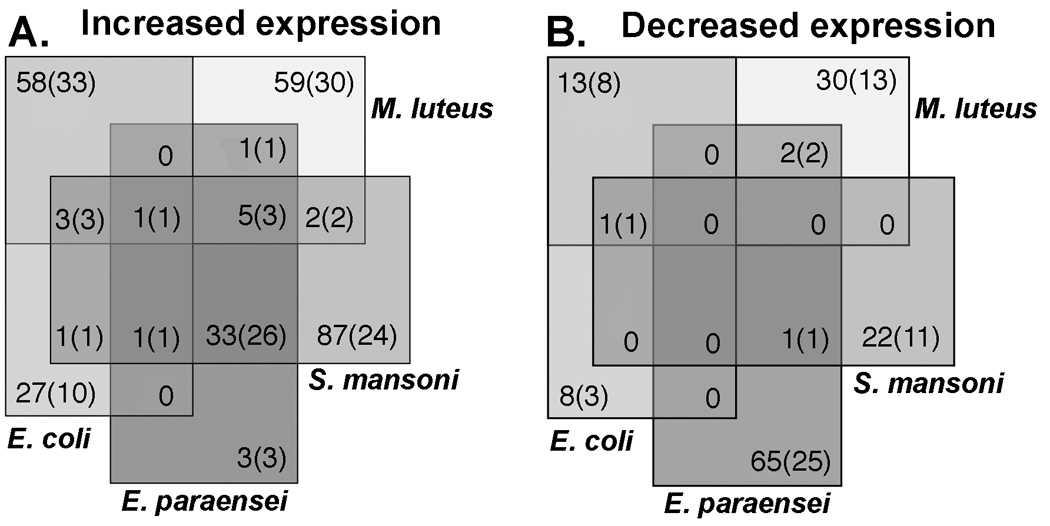
These Venn diagrams show the number of shared and unique features that were up-regulated (a) or down-regulated (b) at 12 hour post exposure to E.coli (Gram negative), M. luteus (Gram positive), E. paraensei and S. mansoni. Each challenge yielded a distinct transcriptome. Note the absence of overlap in features with decreased expression in response to E. paraensei and S. mansoni. The numbers in the Venn diagram represent total number of differentially expressed features with the number of features with unknown function shown in brackets. False Positive Rate ≤ 10%.