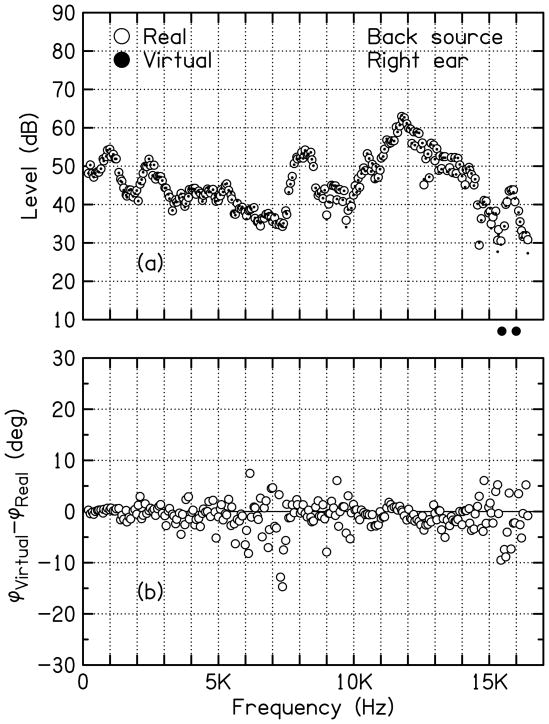
Figure 3.
Typical baseline simulation for the back source as measured in the right ear. (a) The amplitude spectrum for the real source is compared with the virtual source (simulation). Two points below the plot show components that did not meet the ±50% criterion and were eliminated. (b) The spectrum of phase differences between recordings of real and virtual signals.

