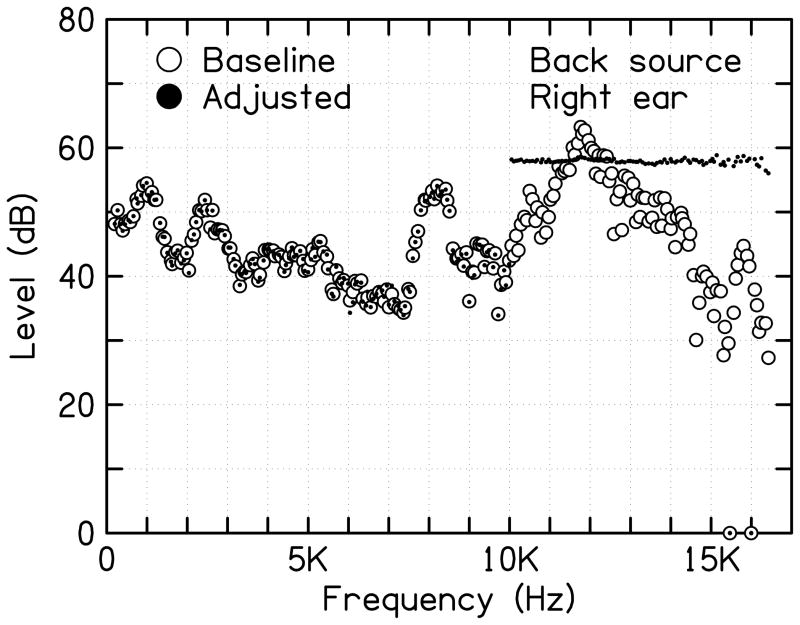
Figure 4.
Experiment 1: Typical simulation for the back source as measured in the right ear. Open circles show the baseline amplitude spectrum. Filled symbols show the modified amplitude spectrum, flattened above 10 kHz. Two components, shown by points on the horizontal axis, were eliminated in the calibration process for the front or the back source.

