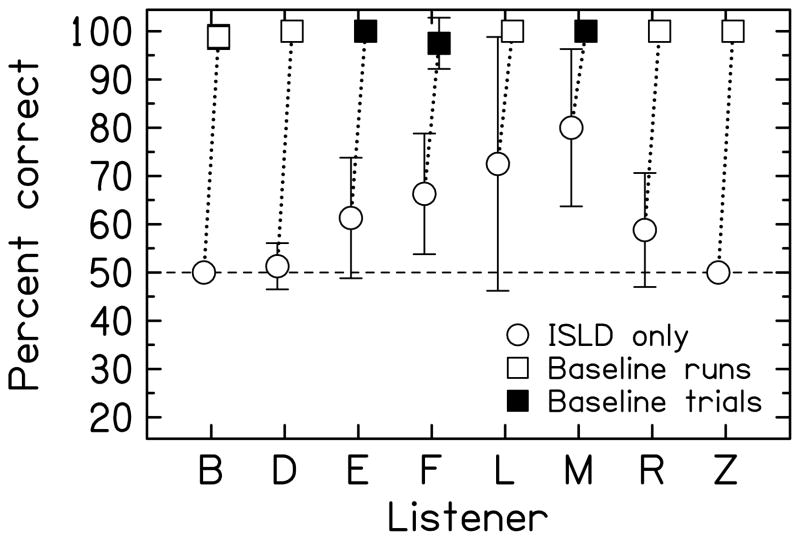
Figure 9.
Experiment 5: Interaural spectral level difference only. Circles show the performance for eight listeners when the amplitude spectrum in the right ear was flattened and the amplitudes in the left ear were modified so as to perfectly maintain the interaural level difference at each frequency. Squares show baseline performance when both ears obtained accurate information. Error bars are two standard deviations in overall length.

